Probability
Why This Matters
Before a cricket match, the captains toss a coin. Why does everyone accept that as fair? Because a fair coin is just as likely to land heads as tails — neither team has an edge. That single, everyday idea is the whole heart of this chapter: when a few outcomes are equally likely, we can put an exact number on “how likely” each one is.
That number is a probability — a measure of chance that runs from 0 (never happens) to 1 (always happens). Weather forecasts, insurance premiums, the odds in a game, even whether a launched satellite is expected to fail — all of them rest on probability. Scientists, doctors and economists lean on it every day to make decisions when the future is uncertain.
In Class IX you found probabilities by doing the experiment many times and counting — tossing a coin 1000 times and seeing how often heads showed up. That’s powerful, but you can’t always repeat an experiment (you can’t relaunch a satellite a thousand times to estimate failure). This chapter takes a smarter route: when outcomes are equally likely, you can calculate the probability directly, without any experiment at all.
The Big Idea
When an experiment has a fixed list of equally likely outcomes, the theoretical (classical) probability of an event E is simply a count: P(E) = (number of outcomes favourable to E) / (total number of possible outcomes). Every probability lies between 0 and 1: an impossible event has probability 0, a sure event has probability 1. And the chance of E not happening fills in the rest: P(not E) = 1 − P(E).
Let’s Break It Down
What theoretical probability is
First, two words we’ll use a lot. An experiment is an action with more than one possible result (tossing a coin, throwing a die, drawing a card). Each possible result is an outcome. An event is any collection of outcomes we care about — like “getting an even number” on a die, which is the three outcomes 2, 4 and 6.
The whole method rests on one assumption: the outcomes are equally likely — no outcome is favoured over another. A fair coin (we say unbiased), a fair die, a well-shuffled deck — all give equally likely outcomes. When that holds, Pierre-Simon Laplace’s 1795 definition gives the probability of an event E directly:
P(E) = (number of outcomes favourable to E) / (total number of all possible outcomes)
That’s it — favourable divided by total. No experiment needed. For one toss of a coin, the two equally likely outcomes are Head and Tail; the event “head” has 1 favourable outcome out of 2, so P(head) = 1/2 and likewise P(tail) = 1/2.
A fair die is thrown once. Find (i) P(getting a number greater than 4) and (ii) P(getting a number less than or equal to 4).
- List all possible outcomes — the faces 1, 2, 3, 4, 5, 6. Since the die is fair, these 6 outcomes are equally likely, so the total is 6.
- (i) The numbers greater than 4 are 5 and 6 — that’s 2 favourable outcomes.
- So P(greater than 4) = 2/6 = 1/3.
- (ii) The numbers less than or equal to 4 are 1, 2, 3, 4 — that’s 4 favourable outcomes. So P(less than or equal to 4) = 4/6 = 2/3. (And notice 1/3 + 2/3 = 1.)
An event with only one outcome is called an elementary event — like “getting a head”, or “the die shows 3”. A neat fact: the probabilities of all the elementary events of an experiment add up to 1. For the die, P(1) + P(2) + … + P(6) = 1/6 × 6 = 1.
The 0-to-1 range: sure and impossible events
The favourable count can never be smaller than 0 or larger than the total, so every probability is squeezed between 0 and 1:
0 ≤ P(E) ≤ 1
The two extremes have names. An impossible event can never happen, so it has 0 favourable outcomes and P = 0. Throwing a single die and getting an 8 is impossible — no face is marked 8 — so P(getting 8) = 0/6 = 0. A sure (or certain) event always happens, so every outcome is favourable and P = 1. Getting a number less than 7 on a die is certain — all six faces qualify — so P(less than 7) = 6/6 = 1.
| Type of event | Favourable outcomes | Probability |
|---|---|---|
| Impossible event | 0 (none) | P(E) = 0 |
| An ordinary event | some, but not all | 0 < P(E) < 1 |
| Sure / certain event | all of them | P(E) = 1 |
A bag holds only lemon-flavoured candies. You draw one without looking. What is the probability it is (a) orange-flavoured, (b) lemon-flavoured?
Complementary events: P(not E) = 1 − P(E)
For any event E, there’s a partner event “not E” — everything that is not in E. We write it E̅. Together E and E̅ cover all the outcomes with no overlap, so their probabilities must add to the whole:
P(E) + P(not E) = 1, which rearranges to P(not E) = 1 − P(E).
E and E̅ are called complementary events. This little formula is a huge shortcut: often the event you want is messy to count directly, but its complement is easy. Instead of counting that, count the complement and subtract from 1.
For example, drawing a card from a deck, P(not an ace) is tedious to count outcome by outcome — but there are 4 aces in 52 cards, so P(ace) = 4/52 = 1/13, and therefore P(not an ace) = 1 − 1/13 = 12/13. Much faster.
The probability that Sangeeta wins a tennis match is 0.62. What is the probability that her opponent Reshma wins? (Assume there is no draw.)
- Exactly one of them wins, so “Reshma wins” is the complement of “Sangeeta wins” — these are complementary events.
- Apply P(not E) = 1 − P(E) with P(Sangeeta wins) = 0.62.
- P(Reshma wins) = 1 − 0.62 = 0.38.
Worked examples: coins, dice and cards
These three setups appear again and again, so it pays to know each one’s outcome list cold. A coin has 2 outcomes (Head, Tail). A die has 6 (the faces 1 to 6). A standard deck has 52 cards in 4 suits of 13 — spades and clubs are black, hearts and diamonds are red; each suit runs ace, king, queen, jack, 10, 9, …, 2, and the kings, queens and jacks are the 12 face cards.
Two different coins are tossed at the same time. What is the probability of getting at least one head?
- List the equally likely outcomes as ordered pairs (first coin, second coin): (H, H), (H, T), (T, H), (T, T). That’s 4 outcomes in total.
- ”At least one head” means one head or two heads — the favourable outcomes are (H, H), (H, T) and (T, H). That’s 3.
- So P(at least one head) = 3/4. (Shortcut via the complement: the only outcome with no head is (T, T), so P(no head) = 1/4 and P(at least one head) = 1 − 1/4 = 3/4.)
One card is drawn from a well-shuffled deck of 52 cards. Find the probability that it is (i) a red king, (ii) a face card, (iii) the queen of diamonds.
- Well-shuffled means all 52 cards are equally likely, so the total number of outcomes is 52.
- (i) Red kings are the king of hearts and the king of diamonds — 2 cards. So P(red king) = 2/52 = 1/26.
- (ii) Face cards are the king, queen and jack of each of the 4 suits — 3 × 4 = 12 cards. So P(face card) = 12/52 = 3/13.
- (iii) There is exactly one queen of diamonds, so P(queen of diamonds) = 1/52.
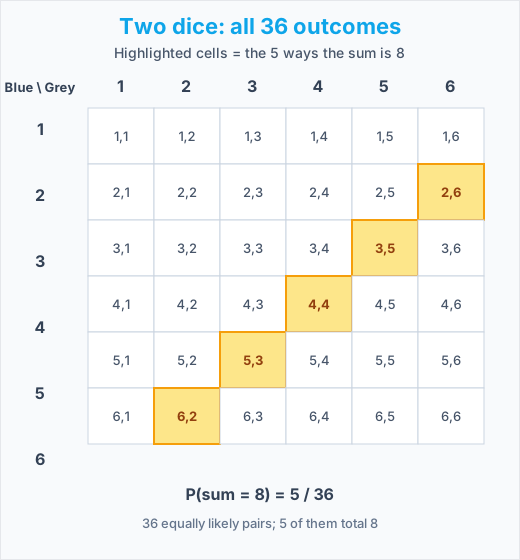
Now the classic two-dice problem. When two dice are thrown, an outcome is an ordered pair (first die, second die), so the pair 1-then-4 is different from 4-then-1. That gives 6 × 6 = 36 equally likely outcomes — best seen as a grid:
Two dice are thrown together. Find the probability that the sum of the numbers on top is (i) 8, (ii) 13, (iii) less than or equal to 12.
- There are 6 × 6 = 36 equally likely outcomes (use the grid above).
- (i) The pairs that add to 8 are 2 and 6, 3 and 5, 4 and 4, 5 and 3, 6 and 2 — that’s 5 outcomes. So P(sum is 8) = 5/36.
- (ii) The largest possible sum is 6 + 6 = 12, so a sum of 13 is impossible — 0 favourable outcomes. P(sum is 13) = 0/36 = 0.
- (iii) Every one of the 36 sums is at most 12, so a sum less than or equal to 12 is a sure event. P(sum ≤ 12) = 36/36 = 1.
Common Mistakes
Any experiment with two results gives each result a probability of 1/2.
Heads-or-tails and many textbook examples really do split 50-50, so 'two options means equal chance' feels like a safe default.
P = favourable/total only works when the outcomes are EQUALLY LIKELY. A bag with 4 red balls and 1 blue ball has two results (red or blue), but they are not equally likely — P(red) = 4/5, not 1/2. Always check that the outcomes are genuinely equally likely before counting.
When two dice are thrown, the sums 2, 3, 4, ..., 12 are 11 equally likely outcomes, so each sum has probability 1/11.
There are exactly 11 possible sums, so treating them as 11 equal outcomes looks tidy and natural.
The 11 sums are NOT equally likely. The equally likely outcomes are the 36 ordered pairs of faces. A sum of 7 happens 6 ways (6/36) while a sum of 2 happens only 1 way (1/36). Count the underlying equally likely outcomes, not the sums.
To find P(at least one head) with two coins, you list the outcomes as 'two heads, two tails, or one of each' — three outcomes — so each has probability 1/3.
'Two heads', 'two tails' and 'one of each' really are the three things that can happen, so calling them three equal outcomes seems reasonable.
'One of each' can occur two ways — (H, T) and (T, H) — so the equally likely outcomes are FOUR: (H, H), (H, T), (T, H), (T, T). 'One of each' has probability 2/4, not 1/3. Break compound outcomes back into the equally likely ones.
P(not E) is just a different fraction you work out from scratch by counting; the value of P(E) doesn't help.
Counting feels like the reliable method, so re-counting the complement seems safer than reusing a number you already have.
E and not-E are complementary: P(E) + P(not E) = 1, so P(not E) = 1 − P(E) ALWAYS. If P(ace) = 1/13, then P(not an ace) = 1 − 1/13 = 12/13 instantly — no need to recount 48 cards. Use the complement; it's faster and avoids errors.
Quick Check
A fair die is thrown once. What is the probability of getting an even number?
Which of these can NOT be the probability of an event?
If P(E) = 0.05, what is P(not E)?
One card is drawn from a well-shuffled deck of 52. What is the probability that it is a face card?
Practice Problems
Easy
A bag contains 3 red balls and 5 black balls. A ball is drawn at random. Find (i) P(red) and (ii) P(not red).
Total balls = 3 + 5 = 8, all equally likely to be drawn.
(i) Favourable to red = 3, so P(red) = 3/8.
(ii) “Not red” is the complement of “red”, so P(not red) = 1 − 3/8 = 5/8. (Check: there are 5 black balls, so 5/8 directly — agrees.)
A die is thrown once. Find the probability of getting (i) a prime number, (ii) a number lying between 2 and 6.
The 6 equally likely outcomes are 1, 2, 3, 4, 5, 6.
(i) The primes among them are 2, 3 and 5 — 3 favourable outcomes. So P(prime) = 3/6 = 1/2.
(ii) The numbers strictly between 2 and 6 are 3, 4 and 5 — 3 favourable outcomes. So P = 3/6 = 1/2.
Medium
A box contains 90 discs numbered 1 to 90. One disc is drawn at random. Find the probability that it bears (i) a two-digit number, (ii) a perfect square, (iii) a number divisible by 5.
Total outcomes = 90 (each disc equally likely).
(i) Two-digit numbers run from 10 to 90, that is 90 − 9 = 81 of them. So P(two-digit) = 81/90 = 9/10.
(ii) Perfect squares from 1 to 90 are 1, 4, 9, 16, 25, 36, 49, 64, 81 — that’s 9 numbers. So P(perfect square) = 9/90 = 1/10.
(iii) Numbers divisible by 5 from 1 to 90 are 5, 10, 15, …, 90 — that’s 90 ÷ 5 = 18 numbers. So P(divisible by 5) = 18/90 = 1/5.
A game of chance has a spinning arrow that comes to rest on one of the numbers 1, 2, 3, 4, 5, 6, 7, 8 (all equally likely). Find the probability that it points at (i) 8, (ii) an odd number, (iii) a number greater than 2.
Total equally likely outcomes = 8.
(i) Only one face is 8, so P(8) = 1/8.
(ii) Odd numbers are 1, 3, 5, 7 — 4 outcomes. So P(odd) = 4/8 = 1/2.
(iii) Numbers greater than 2 are 3, 4, 5, 6, 7, 8 — 6 outcomes. So P(greater than 2) = 6/8 = 3/4.
Challenge
A game consists of tossing a one-rupee coin 3 times and noting the result each time. Hanif wins if all three tosses give the same result (three heads or three tails) and loses otherwise. Find the probability that Hanif loses the game.
List the equally likely outcomes of three tosses as triples of H and T: HHH, HHT, HTH, HTT, THH, THT, TTH, TTT — that’s 2 × 2 × 2 = 8 outcomes.
Hanif WINS on “all same”: HHH and TTT — 2 outcomes. So P(win) = 2/8 = 1/4.
“Lose” is the complement of “win”, so P(lose) = 1 − 1/4 = 3/4.
(Check by direct count: the 6 losing outcomes are HHT, HTH, HTT, THH, THT, TTH → 6/8 = 3/4. ✓)
A die is thrown twice. Find the probability that (i) 5 does not come up either time, (ii) 5 comes up at least once.
Throwing a die twice gives 6 × 6 = 36 equally likely ordered pairs.
(i) “5 does not come up either time” means neither throw is a 5. Each throw then has 5 allowed values (1, 2, 3, 4, 6), so favourable outcomes = 5 × 5 = 25. So P(no 5 either time) = 25/36.
(ii) “5 comes up at least once” is the complement of “no 5 either time”. So P(at least one 5) = 1 − 25/36 = 11/36.
(This shows the power of the complement — counting “at least once” directly would mean adding up several cases, but 1 minus the easy count does it in one line.)
Summary
You should now be able to explain:
- The theoretical (classical) probability of an event E is P(E) = (number of favourable outcomes) / (total number of all possible outcomes), provided the outcomes are equally likely.
- The probability of a sure (certain) event is 1; the probability of an impossible event is 0.
- Every probability lies in the range 0 ≤ P(E) ≤ 1.
- An elementary event has just one outcome, and the probabilities of all elementary events of an experiment add up to 1.
- For any event E, P(E) + P(not E) = 1, so P(not E) = 1 − P(E); E and not-E are complementary events, and the complement is often the quick way to an answer.
- Know your outcome lists: a coin has 2 outcomes, a die has 6, two dice have 36 ordered pairs, and a deck has 52 cards (4 suits of 13, with 12 face cards).
- Experimental probability (Class IX) comes from actually repeating trials; theoretical probability predicts the chance from assumptions. As the number of trials grows, the two get closer and closer.
What’s Next
This is the last chapter of your Class 10 Maths journey — and a fitting place to look back. Notice how it pulls together threads from across the year: the fractions and ratios behind every P(E), the careful listing and counting that echoes the logic of earlier chapters, and the comfort with 0, 1 and everything between that runs through real numbers and beyond. From Real Numbers and Polynomials to Linear Equations, Quadratics, Trigonometry, Coordinate Geometry, Areas and Volumes, Statistics and now Probability, each chapter has been one more tool for describing the world precisely. Probability is special because it lets you reason confidently even when you can’t be certain — exactly the situation in most real decisions. Keep applying this maths: estimate, model, check, and predict. You now have a full toolkit — go use it.